Structured Missingness#
An alternative way of characterising missing data, known as structured missingness (SM), has been pioneered by researchers of the Turing-Roche Partnership. SM arises in data that is MCAR, MAR or MNAR, and whose missingness has some structure or pattern [MMC+23]. Specifically, standard definitions of missinginess mechanisms (such as those introduced in Missing Data Structures) assume that the missingness of one variable is independent of the missingness in another, when conditioning on the relevant data. In contrast, the missingness of a variable can depend on the data and the missingness of other variables in SM [JMH+23].
This is common in research contexts where data is combined from multiple studies or sources. For instance, many large-scale healthcare studies are multimodal and attempt to include a diverse set of patients, therefore capturing data for a heterogeneous group of individuals. Therefore, data is often collected at multiple time points and multiple sites, where different measurements may be taken, such as clinical, genomic or imaging measures. Our example dataset (introduced in Missing Data Structures) is also an example of SM.
Example: The missing values in the blood test results, blood pressure readings, and cognitive scores are all examples of SM. The blood test results (MCAR) are due to batch failure. The cognitive score missing values (MNAR) are missing in participants with significant cognitive decline. The blood pressure readings (MAR) are missing in participants that could not attend the clinic due to being older and having more motor dysfunction. Therefore, the missingness in all these variables are not equally likely for all individuals, even after conditioning on the relevant data. The missingness has some information that can be leveraged in further analyses and this would be also considered as SM.
Moreover, the missingness present here is directly related to digital health equity and fairness, as certain participants were unable to attend due to differences in accessibility. Therefore, this example also demonstrates potential ethical consequences and importance of analysing data missingness by interrogating the missingness structure or patterns.
Participant Number
Age
Diastolic Blood Pressure
Systolic Blood Pressure
Blood Test Result
Motor Score
Cognitive Score
1
56
82
118
N/A
10
35
2
78
87
134
N/A
32
29
3
85
N/A
N/A
N/A
27
N/A
4
43
83
121
Negative
15
36
5
67
86
131
Positive
20
25
6
82
92
133
Negative
26
N/A
7
88
N/A
N/A
Positive
34
N/A
8
71
N/A
N/A
Negative
33
22
Not all forms of structured missingness can have the same consequences on data. For instance, a complete case analysis may have bias introduced due to the missing blood pressure readings (MAR) and cognitive score (MNAR) values, while the blood test (MCAR) values would not introduce bias, but would decrease statistical power. MAR data may introduce bias by selecting a non-representative subset of the data. This is similarly the case for MNAR, but as the mechanism behind the missingness is not apparent, handling this bias in subsequent analysis can be challenging.
Many datasets, fusing data from multiple sites and modalities, do take care to follow a certain design and data collection process. However, machine learning methods perform best with large datasets. It is common practice for a machine learning model to include data from many studies, often with different designs and variables. Missing values may therefore include information in and of themselves; they may be related to sampling methodologies or reflect population characteristics. Traditional imputation methods, such as those introduced in ref{pd-missing-data-methods}, frequently are not appropriate for handling SM and do not take advantage of the information inherent in SM [MMC+23]. SM also has consequences for downstream analyses; if there is bias to the SM mechanisms, the fairness of the model would be in question. Further research is required to identify appropriate methods for universally handling SM and in defining SM within the MCAR, MAR, and MNAR framework [JMH+23].
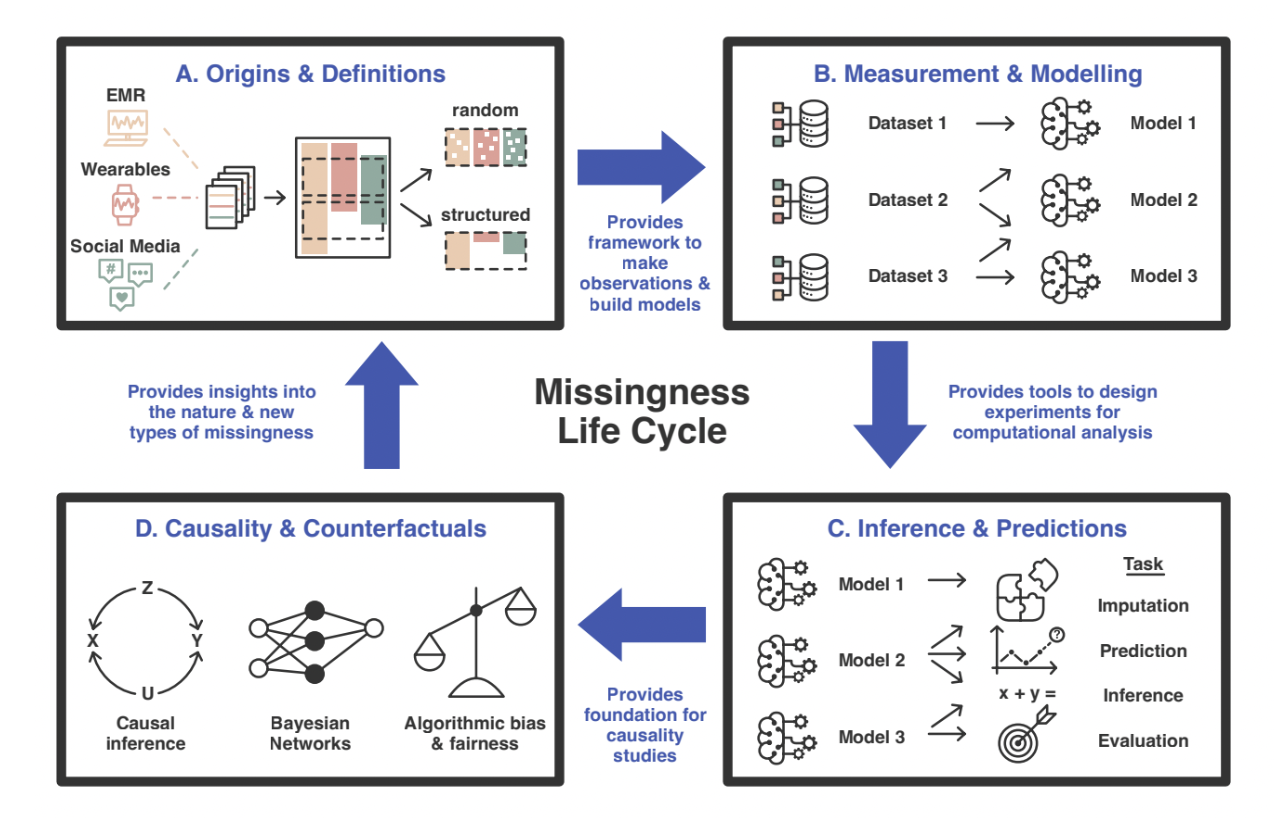
Fig. 90 Overview of the structured missingness (SM) life cycle [Text adapted from: [MMC+23]]. A. In a given dataset, data may come from different sources and modalities. Some examples are electronic medical records (EMR), wearable devices, or social media. Data may not be collected at the same time or for the same individuals in each case, which may result in both random and SM when joining these data sources together. Researchers are working on developing tools to minimize the effects of SM on any downstream analysis. B. Unique models can be built using different combinations or portions of datasets. However, SM may affect how models learn from data and cause bias. Researchers similarly need to develop tools that handle and adapt SM appropriately. C. These models can then be used to perform analysis, inferences, and predictions. Effective data imputation can have a large impact on results. Therefore, it is important to evaluate and benchmark the consequences of data imputation. D. Often the end goal of a scientific exploration is to understand causality between different variables. Inferences obtained can provide the foundation for determining causality and counterfactuals, but can be compromised by the presence of SM. The SM life cycle then repeats as these insights can be used to further understand the missingness of the data.#
Therefore, developing tools that address SM at every step of the cycle is important so that insights and analysis is unbiased. Researchers are trying to solve these different SM challenges.
Summary#
SM is a new and expanding area of research that aims to improve large-scale statistical and machine learning analyses, by reducing model degradation and bias.