
Spreadsheets, such as Microsoft Excel files, google sheets, and their Open Source alternative (for instance) LibreOffice, are commonly used to collect, store, manipulate, analyse, and share research data. Spreadsheets are convenient and easy-to-use tools for organising information into an easy to write and easy to read forms for humans. However, one should use them with caution, as the use of an inappropriate spreadsheet is a major cause of mistakes in the data analysis workflow. See for example the loss of COVID19 data in England due to poor use of Excel. There is a collection of horror-stories that tells how the use of spreadsheets can ruin analysis-based studies due to unexpected behaviour of the spreadsheet or error-prone editing processes. Some of these mishaps are not unique to spreadsheets, but many, such as Gene name errors (and another Gene name error example), are.
Fortunately, most problems can be avoided with the following recommendations:
- Use spreadsheet in a text-only format (.csv or .tsv),
- Create tidy spreadsheets,
- Make spreadsheets consistent (with each other) and implement rules for data entries, and
- Avoid manipulating and analysing data in spreadsheet software (this includes copy-paste).
Spreadsheets are a powerful tool only if the dataset is collected and organised in specific formats that are usable for both the computers and researchers.
1. Avoid Non-Data Content
Spreadsheets are used for organising data in a tabular form.
The subject, the object and the relationship between them are transformed into rows, cells and columns, respectively.
For example, the subject: experiment, relationship: was performed on the date, and the object: 2020-06-06 gives one row for each experiment, one column for date of experiment, and the value 2020-06-06 in the cell.
Unfortunately, spreadsheet programs allow you to add other kinds of contents to this, like color to specific cells.
While it may help the researchers at some point, one needs to remember that this kind of cell modification should not be considered as data, primarily because they cannot be exported to other software.
As a simple rule, what can be exported in a text-only format, comma-separated values (CSV), or tab-separated values (TSV), can be considered as the data. Other functions should be avoided when using these programs for research data. This includes:
- cell formatting, such as changing font, color or borders,
- using functions,
- merging cells (this one is particularly problematic),
- using specific cell formats (especially dates, see below).
As a test for your spreadsheet compatibility with reproducible research, export your data from the spreadsheet to the CSV format and reopen it. If you can still get all the information that you stored in your sheet, then your data is fine.
2. Tidy Format For Spreadsheets
If the spreadsheet is poorly organised, then it may be difficult for collaborators to easily read-in and re-use your data for further analysis.
Indeed, a large part of the work of data scientists is to transform the data into a form that the computer can read. However, this is incredibly time-consuming when the information is split between several spreadsheets and when there are no concrete data transformation plans before the data is acquired.
There are very simple rules to facilitate data use, which go into the concept of tidy data Wickham, 2014. The tidy data format allows for filtering and sorting data easily in spreadsheet software.
In short:
- One column = one variable (no more, no less, this implies that two header names can not be identical)
- One row = one sample
- One cell = one information
- The first row is the header
- Header names must not include a special character (including space) or start with a number
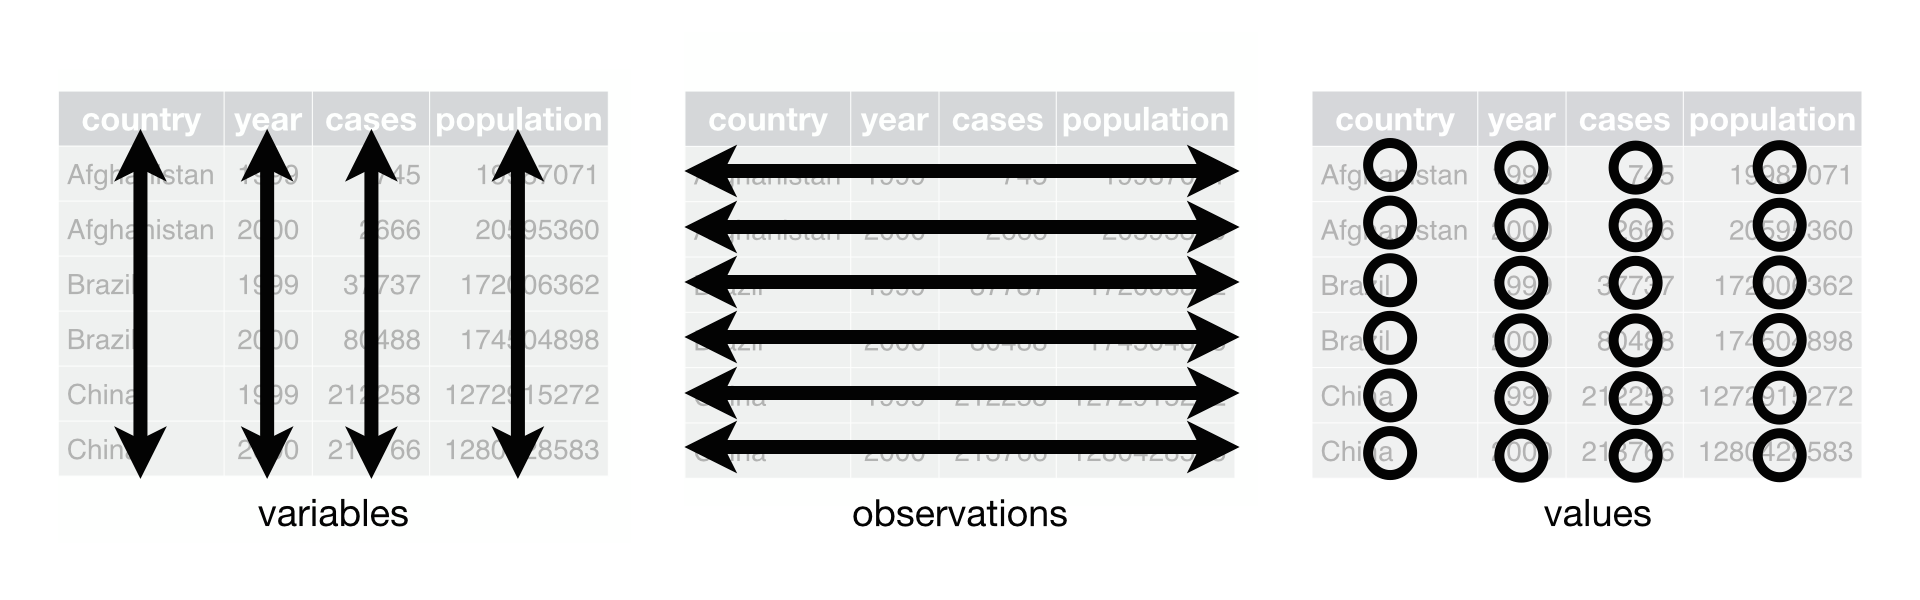
Figure 1:An illustration of tidy data.
Three rules make a dataset tidy:
- Each variable must have its own column.
- Each observation must have its own row.
- Each value must have its own cell.
There are data validation tools available, like https://
3. Consistent Values
When you work with several spreadsheets or with a team during data collection, it is crucial to make sure the same information will be entered with the same term, and that the same term always conveys the same information.
In the example of iris data, if some people use different terms to record information for a specific column - such as naming the column species instead of Species or using iris setosa, set. or i.setosa instead of setosa - the creation of a reproducible workflow will be more difficult, and errors may even be overlooked.
Discrepancies often lead to errors, especially when the same terms could mean different things depending on who is entering the data.
For example, indicating date as 02-03 will mean February the 3rd in the USA, but March the 2nd in Europe.
It is good practice to implement a data dictionary or a taxonomy of accepted terms and document the convention used in a README file.
Depending on the software you use, you may be able to restrict the accepted values in specific columns.
If such a taxonomy or ontology is available, using it may allow you (and others) to use the data in conjunction with other datasets.
For example, you may use the generic male and female term for the sex of an animal (without capitals, and without using abbreviation), as many ontologies use these terms.
Besides, you may want to use some extra tools to validate the spreadsheets before its integration in the analysis.
Missing data points
You should also have clear rules about missing data points.
Using NA, NULL, or empty cells is not trivial and may have different meanings (impossible data point, not recorded, or lost data point).
Imagine a researcher wants to record the time spent before seeing a pollinator land on an iris flower, and no pollinator was seen during the 10-minute experiment.
Suppose the researcher reports 600 (the duration of the experiment in seconds).
In that case, there will be no way to distinguish a scenario where no pollinator was seen, and one when a pollinator was seen at the end of the experiment (and you may forget that rule and treat 600 as a normal value).
If NA is reported, one may interpret this value as a non-existing data point (the experiment had not been performed).
An elegant solution is to have a second column stating whether a pollinator was seen during the experiment, where TRUE, FALSE and NA values are accepted.
Finally, you should also be aware of the default behaviour of your spreadsheet program, as it may be different for different programs, and different versions of the same program.
For instance, the decimal is usually indicated with a comma in the French or German versions of Excel.
In the English versions, a dot is used since the comma has no meaning (9,000 will be translated into 9000 or 9 depending on the version you are using).
4. Data Manipulation and Analysis
When you manually manipulate data in a spreadsheet program, you will need to record all the steps that you took. This can be time consuming and can be avoided by manipulating and analysing the data with automatic analyses or programmes such as Open Refine that will record the data manipulation steps for you.
OpenRefine can be used for tabular data (for example in social sciences, ecology and history. OpenRefine can help you to get an overview of large datasets, identify and correct inconsistencies, and integrate datasets. It automatically records these processes, saving a script of the steps involved. OpenRefine uses your web browser as a graphical interface, but the software runs only locally so it is safe to use for sensitive data.
Automatic manipulation will also help with data validation, as software may return error messages if data is manipulated incorrectly.
5. Data validation
- Excel support page on data validation
- Check manually whether your data is consistent, complete and correct:
- If a column should contain only numeric values or characters, check that there are no non-numeric values or non-character
- Check for consistency in names, unit of measurements, data type and so on
- Check if there are any empty cells and replace them with your chosen null value (see above)
- Remove redundant data (while keeping in mind what could be reused in the future!)
6. Accessibility
Comma- or Tab-Separated Value (CSV/TSV) formats are not only best for preservation, but for accessibility as well. For more information:
- Data Curation Primer
- Make your Excel documents accessible to people with disabilities (Microsoft Office)
- Excel Tips (Accessibility and Usability at Penn State)
- Create Accessible Spreadsheets (General Services Administration of the 49 U.S. - focused on Excel)
Other Tips
Dealing With Time Information
While dates should be written as yyyy-mm-dd, Excel and other software tend to transform this data into their own date formats (even during data import from a CSV file).
The only 100% secure way to deal with this is to make different columns for years, months, and days and recreate the data in the software used for analysis. Time entered with hh:mm:ss normally works.
Working With Several Sheets
We often use several sheets for different but related data.
It is a handy tool indeed, especially when one wants to share the complete dataset with colleagues.
On the other hand, CSV files only save one sheet at a time.
Though most data analysis software have several ways to import xlsx files, the practical solution is to work with the xlsx format while making sure that the information is available in CSV format for each sheet.
A better solution, especially for long term storage, is to save all sheets separately in a CSV file and zip them together.
This solution also allows including extra documentation that could be in a different format (for example, a text file explaining the meaning of the headers and the chosen unit).
Spreadsheet Design
Data is often collected manually, on paper. To be most efficient and avoid mistakes, it is best to collect the data in the same format as it will be digitalised. That is, one should design the computer-readable spreadsheet to be printed for data collection. This poses some design questions, especially for information that is unique to one experiment (one paper) but may change between experiments (for example, experimentalist or temperature of the room). You indeed want that information in one column, but you would like to enter it only once during data acquisition (especially on the paper version). One solution is to move these columns onto a second (non-printed) page on the spreadsheet and adjust the headers and footers to enter the information on the paper version. One needs to make sure the information is entered in the column during digitalisation.
The way you enter the information (that is, the way you design your headers and cell content) may be different depending on the analysis you want to perform. One should still always try to be as generic and objective as possible and think about any additional analyses one may want to perform.
As an example, let us suppose you are interested in depicting if the percentage of flowers whose sepal length is longer than 6 mm is different in three iris species.
You may be inclined to record a true or false column is-sepal-longer-than-6cm, but this will restrict the analysis you can perform.
A better solution is to record the length of the sepal (in mm) and automatically create the categorization later.
If you are using R, you would then plot what you wanted with:
iris %>% ## the iris dataset is included in R base
  dplyr::mutate ("is-sepal-longer-than-6cm" = ifelse(Sepal.Length >6, TRUE, FALSE)) %>% ## this create the new column
  ggplot2::ggplot (aes (x=`is-sepal-longer-than-6cm` , fill= Species)) + ggplot2::geom_bar() ## this plots the data
Headers names should be chosen with care, and when it is not clear what is meant and what unit is used, you may want to add some explanation in an external document. You may also share a sample spreadsheet to a colleague to receive feedback on how understandable your sheet is.
Another alternative is to add some explanations on top of the sheet in the first rows before the headers. By keeping human-readable information at the top of the file, one can better understand the data that starts in the header rows. This information can also help in analysing that data, making sure that the scripts ignore the explanation lines and only consider it during analysis. However, a good file with tidy columns and rows should not need extra explanation.
As for header names, the size of the headers is not an issue for computers. However, for human readability, it is better to keep it short (up to 32 characters).
You do not have to think about the order of the columns for the analysis, as it has no importance for data analysis software. You can, therefore, completely optimise that parameter for the data collection step.
Standard and Versioning
A good spreadsheet design has instructive and intuitive header names, and it facilitates both data collection and analysis. Building such a spreadsheet design is difficult as it takes time, multiple iterations, and consensus. It is therefore beneficial to look for a standard spreadsheet before designing your own and to share your design openly once it is created. One should also use a version history of the spreadsheets (as they will evolve), and the analysis script should mention the version number of the spreadsheet. Documentation of the spreadsheet, its version history, and the ontologies it is linked to, can be useful for future users.
Working In A Team
If you are working with a team on data collection, make sure:
- Everyone uses the same software (and software version) to enter the data.
- Everyone uses the same version of the spreadsheet template.
- Everyone understands what each column represents, and the unit that should be used.
- Every column has a defined standard on how to enter data in it or taxonomy of terms that one can use.
- One person is responsible for answering putative questions during data collection.
- Every spreadsheet is validated before entering the analysis workflow, and as soon as possible.
Summary
While spreadsheets can be a very user-friendly way to collect and share data, they can also be the source of mistakes if misused. When aiming at developing a reproducible workflow for analyses, one should design the spreadsheet for both computer and human readability, and, even before starting data collection, they should consider what would make their data analysis easy. Data manipulation and analysis in spreadsheets, in particular, is best avoided as it leads to non-reproducible workflows. Using version control and making the data read-only are two additional data management practices that can prevent accidents.
Use a README [def] file and and other structure choices to explain naming conventions. It will make it clear to others what the file and header names mean, and what criteria to consider when designing an analysis workflow. If you work in a team, you should take particular care of the conventions and make sure everyone follows them.
To learn more about data organisation in spreadsheets, you may have a look at the Data Carpentry lessons for Social Scientists and Ecologists.
To read about recommended practices, see Broman & Woo, 2018
See also a blogpost with resources for using spreadsheets in research and moving onto other tools.
- Ziemann, M., Eren, Y., & El-Osta, A. (2016). Gene name errors are widespread in the scientific literature. Genome Biology, 17(1). 10.1186/s13059-016-1044-7
- Zeeberg, B. R., Riss, J., Kane, D. W., Bussey, K. J., Uchio, E., Linehan, W. M., Barrett, J. C., & Weinstein, J. N. (2004). Mistaken Identifiers: Gene name errors can be introduced inadvertently when using Excel in bioinformatics. BMC Bioinformatics, 5(1). 10.1186/1471-2105-5-80
- Wickham, H. (2014). Tidy Data. Journal of Statistical Software. 10.18637/jss.v059.i10
- Broman, K. W., & Woo, K. H. (2018). Data organization in spreadsheets. The American Statistician, 72(1), 2–10. 10.1080/00031305.2017.1375989