As multiple reports from the United Nations (such as IPCC | Climate Change 2023: Synthesis Report and WMO | Global Annual to Decadal Climate Update) have shown, the global climate crisis impacts all of us. From this, reducing carbon emissions has emerged as a means of addressing the climate crisis. For those of us that do computing as part of our day-to-day work, it can form a significant part of our environmental impact, both for us personally and for our organisation(s). In particular, if you or your group does intensive computing, making use of high-performance computers or cloud resources, for example to train intricate models or run complex simulations, the carbon footprint can be sizable.
For this reason, it is important to consider the environmental impact of the computational work you and your colleagues and collaborators do, including having awareness of the possible scale of it in relation to other activities you undertake as part of day-to-day life. With this awareness, it follows that we should all aim to reduce our carbon footprint for our work activities.
This guide helps data and computational scientists to better understand the environmental impacts of their work and projects, as well as providing suggestions for reducing the impact of it.
The topic is not new, it has for example been discussed during CW23.
Understanding the problem
Most of us are aware of the general context of our planet being subject to climate change that results largely from human influence, and how this poses a great threat to our society. However, in case you are not, and indeed to emphasise this crucial background, we’ll summarise this background.
Climate change summarised
Human activities, notably the burning of fossil fuels like oil, gas or coal, to generate electricity and to power cars (amongst many other tasks) release greenhouse gases into the atmosphere. These gases, such as carbon dioxide, trap heat in the atmosphere, which in turn raises the temperature of the surface of the Earth. While not linear, over time, the global average temperature rises.
Rise in global temperatures illustrated
The rise in this global average temperature is strikingly illustrated by the ‘Warming Stripes’ (‘#ShowYourStripes’) project, a minimalist-style data visualisation created by Ed Hawkins. Average Earth surface temperatures are indicated as stripes in blue hues, representing cooler temperatures, through to red hues, representing warmer ones, where each stripe covers a single year.
The general trend shows a progression, over the past few centuries or so, from there being more blue on the left (towards the past) to more red on the right (towards the present). In short, the surface of our planet is, overall and year-on-year, warming!

Figure 1:Global warming stripes, by Ed Hawkins.
This more verbose figure makes it more explicit what the global warming stripes represent. You can find these and more figures on the canonical warming stripes page.
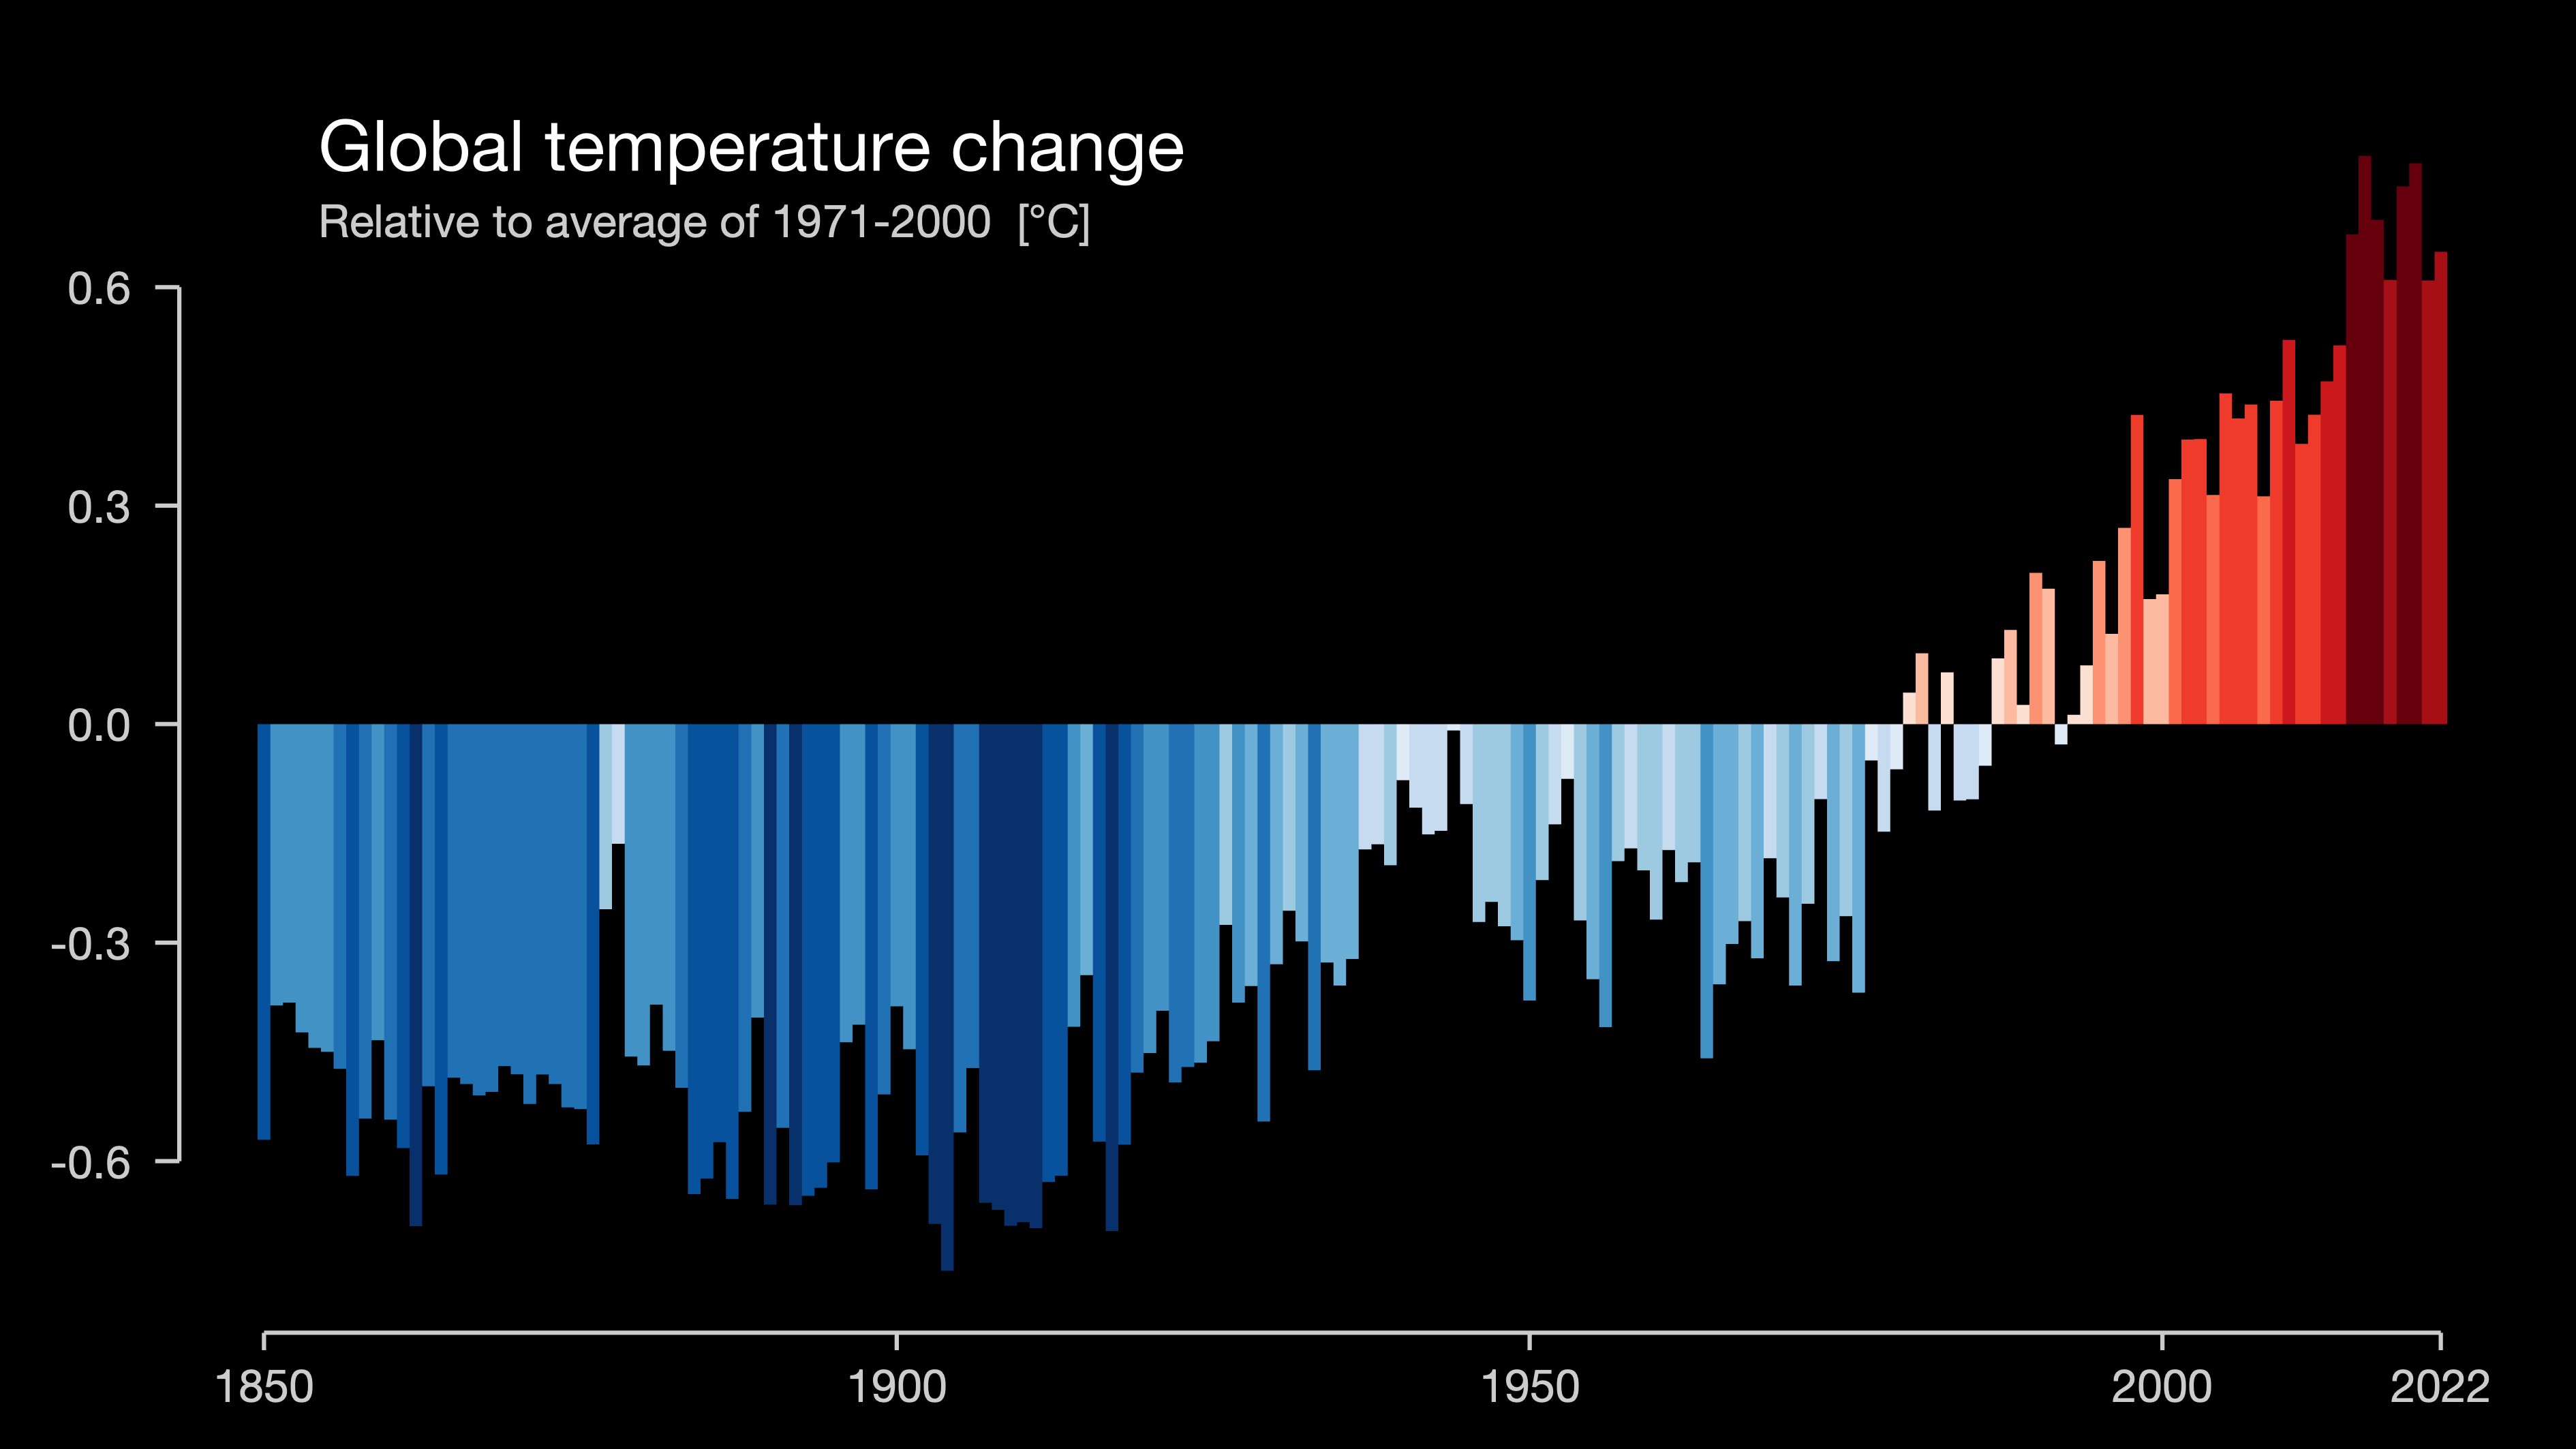
Figure 2:Bars with Scale, by Ed Hawkins.
Awareness raising
Below we share some thought-provoking questions about the Environmental Impact of Digital Research.
Where in the world did your last computer end up? An estimated 50 million tons of electronic waste are discarded each year. This is equivalent to throwing out 1000 laptops every single second. Less than 20% of e-waste is formally recycled, with 80% either ending up in landfill on developing countries, exposing vulnerable populations and their environment to health and pollution impacts (ref: https://
www3 .weforum .org /docs /WEF _A _New _Circular _Vision _for _Electronics .pdf). How much unused or inaccessible data do you have on the cloud? In 2021, on average, 35% of enterprise data is “dark,” meaning it has an unknown value, while 50% is redundant, obsolete or trivial. Only about 16% is business-critical, the study concluded. (ref: https://
www .veritas .com /content /dam /Veritas /docs /reports /GA _ENT _AR _Veritas -Vulnerability -Gap -Report -Global _V1414 .pdf) How much of the world’s total electricity will the technological sector use by 2025? It is predicted that by 2025, the technology sector will consume 20% of the world’s total electricity (compared to 7% in 2022). Ref: https://
www .tier1 .com /the -environmental -impact -of -our -data -storage/)
Strategies for reduction
There are several things that can be done to reduce the environmental impact of digital research. In this section we describe some of the possible actions grouped in two major groups, computing and data, and links to external resources that can implement them.
These actions are not listed in any order of importance, and implementing any or some of them is better than not doing anything at all.
You can also read ‘Ten simple rules to make your computing more environmentally sustainable’ Lannelongue et al., 2021 and the Digital Humanities Climate Coalition Toolkit.
Computing
As we engage in research activities, our utilization of computers and code execution significantly affects the environment. In this section, we explore approaches that can be employed to mitigate the environmental impact arising from the computational aspects of our research endeavors.
Improve code efficiency
As mentioned above, the amount of energy spent on running a computation depends on how long the particular computation runs. One way of reducing the energy spent is to optimize the code to make it run faster.
Several studies show the energy intensity of computing tasks such as training Natural Language Processing models Strubell et al., 2019Schwartz et al., 2020, astrophysics simulations Zwart, 2020, bioinformatics Grealey et al., 2022, and so forth.
Optimizing GPU code for energy efficiency is one way to reduce energy usage Schoonhoven et al., 2022
Improve hardware efficiency
In some cases it is possible to run hardware in more energy-efficient modes. One relevant example is the ARCHER2 national high-performance computer service in the UK where three different CPU frequencies can be selected at run time. A 2022 study investigated the performance / power use trade off and discovered the power usage could often be reduced without noticeable alteration in the run time of most applications, by changing the CPU frequency to a different value from the three possibilities. As a consequence the service reduced the default CPU frequency and updated the user-facing documentation in this area (see Turner, 2022).
For the Summit supercomputer it is known that about 63.8% of the power is consumed by GPUs Stachowski et al., 2020.
Avoid unnecessary tasks
Another way of reducing energy usage is to avoid running task unnecessarily. Some examples include:
- Running CI[https://
book .the -turing -way .org /reproducible -research /ci /ci -options .html] only when it is useful. For example: do not run unit tests when changes are made in the documentation and not on the code. - If you do test-driven development, run only tests that have previously failed. In this way you do not need to test code which you already know has been tested. You can use this GH action for limiting when tests (pytest) are run: https://
github .com /marketplace /actions /pytest -last -failed - Run CI with smaller datasets.
Schedule tasks at low-emission time
Energy usage at different times of the day has different carbon intensity. This means that there is also an opportunity to reduce carbon emissions by running computing jobs at different times of the day. While the energy usage remains the same, the carbon intensity can be lowered in this way.
The Climate Aware Task Scheduler (CATS)[https://
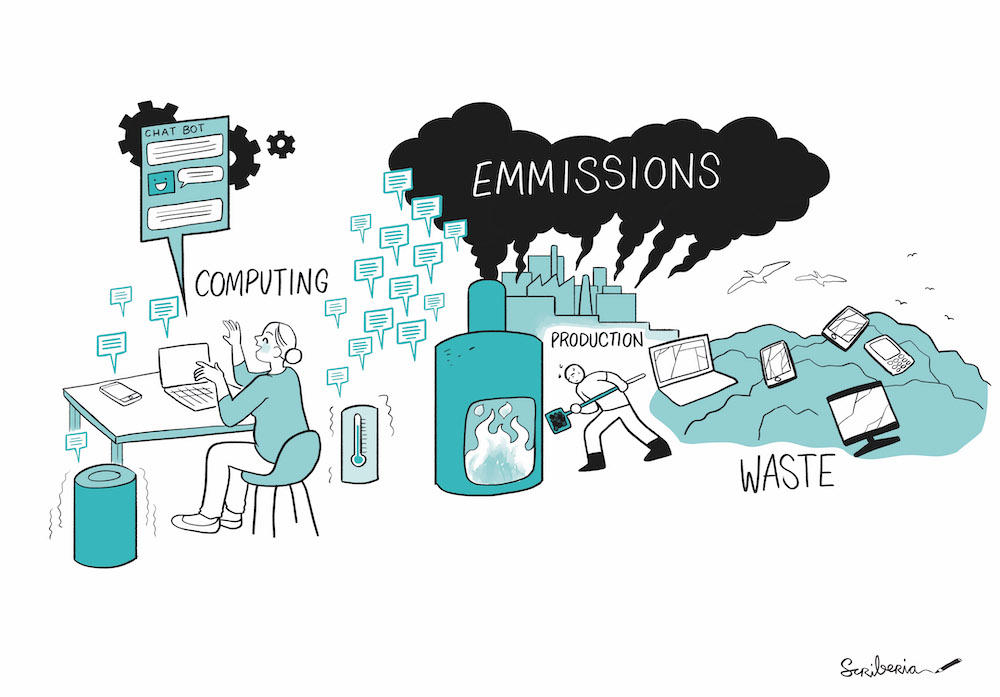
Figure 3:Illustration of the potential environmental impact of digital research. The Turing Way project illustration by Scriberia. Used under a CC-BY 4.0 licence. DOI: Community & Scriberia (2023).
Data
The increasing amount of digital research and the associated storage requirements have implications for the environment, and understanding the environmental impact is key for sustainable scientific research practices. One important aspect to consider is the environmental impact of digital storage:
Data reduction
Reduction of data volumes is a straight-forward solution to minimize energy consumption in storage systems:
- Compression or deduplication can help to detect and delete repeated information.
- Optimized data requires less time for transfer and consumes less network bandwidth.
Standardisation
Storing your data in a standardised data format can have a positive impact on the environment:
- Utilize data formats that are widely accepted within your community to prevent the need for conversion by those interested in reusing your data.
- Similarly, embrace standardized variable names and, if applicable to your data, employ standardized physical units.
In addition, if possible deposit your datasets in domain specific or community archives so that users are promptly informed about the availability of your data. This can also avoid duplication of effort and recomputation/acquisition of the same data.
Green Data Centers
The usage of shared computing and storage infrastructure is usually a way to reduce the impact of data storage in the environment. The reason is that most data centres invest in energy-efficient servers, storage systems, and networking equipment. This includes using hardware components with high energy efficiency ratings and employing advanced cooling techniques to reduce power consumption. In addition, the implementation of virtualization technologies allows for better usage of server resources.
Finally, some data centers are shifting towards renewable energy sources (solar, wind, hydroelectric power) and reducing their dependencies on fossil fuels.
The greenest data/HPC centers are listed on the GREEN500 list.
Whenever you can choose, select data centers that are committed to reducing their carbon footprint.
Other resources
Computation
- GreenvAlgorithms
- Green Algorithms: Quantifying the Carbon Footprint of Computation
- Carbon footprint estimation for computational research
- Energy and Policy Considerations for Deep Learning in NLP
- Green AI
- On the Dangers of Stochastic Parrots: Can Language Models Be Too Big?
- Digital Humanities Climate Coalition
- Wren Carbon calculator
- Turner (2022) Study of the impact of CPU frequency on ARCHER2.
- ARCHER2 documentation
Data
- Green Scientific Data Compression
- Environmental Impact of Video streaming
- Next-generation high-temperature data centers
- Zero energy consumption data centers
Credits
This document draws on discussion from the Software Sustainability Institute’s Collaborations Workshop 2023 (CW23), and in particular on the “Raspberry” discussion and speed blogging session on “How do you track the environmental impact of computing?”. We thank all participants of CW23 for engaging around this topic.
- Lannelongue, L., Grealey, J., Bateman, A., & Inouye, M. (2021). Ten simple rules to make your computing more environmentally sustainable. PLOS Computational Biology, 17(9), 1–8. 10.1371/journal.pcbi.1009324
- Strubell, E., Ganesh, A., & McCallum, A. (2019). Energy and Policy Considerations for Deep Learning in NLP. CoRR, abs/1906.02243. http://arxiv.org/abs/1906.02243
- Schwartz, R., Dodge, J., Smith, N. A., & Etzioni, O. (2020). Green AI. Commun. ACM, 63(12), 54–63. 10.1145/3381831
- Zwart, S. P. (2020). The ecological impact of high-performance computing in astrophysics. Nature Astronomy, 4(9), 819–822. 10.1038/s41550-020-1208-y
- Grealey, J., Lannelongue, L., Saw, W.-Y., Marten, J., Méric, G., Ruiz-Carmona, S., & Inouye, M. (2022). The Carbon Footprint of Bioinformatics. Molecular Biology and Evolution, 39(3). 10.1093/molbev/msac034
- Schoonhoven, R., Veenboer, B., van Werkhoven, B., & Batenburg, K. J. (2022). Going green: optimizing GPUs for energy efficiency through model-steered auto-tuning.
- Stachowski, M., Fiebig, A., & Rauber, T. (2020). Autotuning based on frequency scaling toward energy efficiency of blockchain algorithms on graphics processing units. The Journal of Supercomputing, 77(1), 263–291. 10.1007/s11227-020-03263-5
- Community, T. T. W., & Scriberia. (2023). Illustrations from The Turing Way: Shared under CC-BY 4.0 for reuse. Zenodo. 10.5281/ZENODO.8169292
- Lannelongue, L., Grealey, J., & Inouye, M. (2021). Green Algorithms: Quantifying the Carbon Footprint of Computation. Advanced Science, 8(12). 10.1002/advs.202100707
- Bender, E. M., Gebru, T., McMillan-Major, A., & Shmitchell, S. (2021, March). On the Dangers of Stochastic Parrots. Proceedings of the 2021 ACM Conference on Fairness, Accountability, and Transparency. 10.1145/3442188.3445922
- Zhang, Y., Shan, K., Li, X., Li, H., & Wang, S. (2023). Research and Technologies for next-generation high-temperature data centers – State-of-the-arts and future perspectives. Renewable and Sustainable Energy Reviews, 171, 112991. 10.1016/j.rser.2022.112991
- Güğül, G. N., Gökçül, F., & Eicker, U. (2023). Sustainability analysis of zero energy consumption data centers with free cooling, waste heat reuse and renewable energy systems: A feasibility study. Energy, 262, 125495. 10.1016/j.energy.2022.125495